
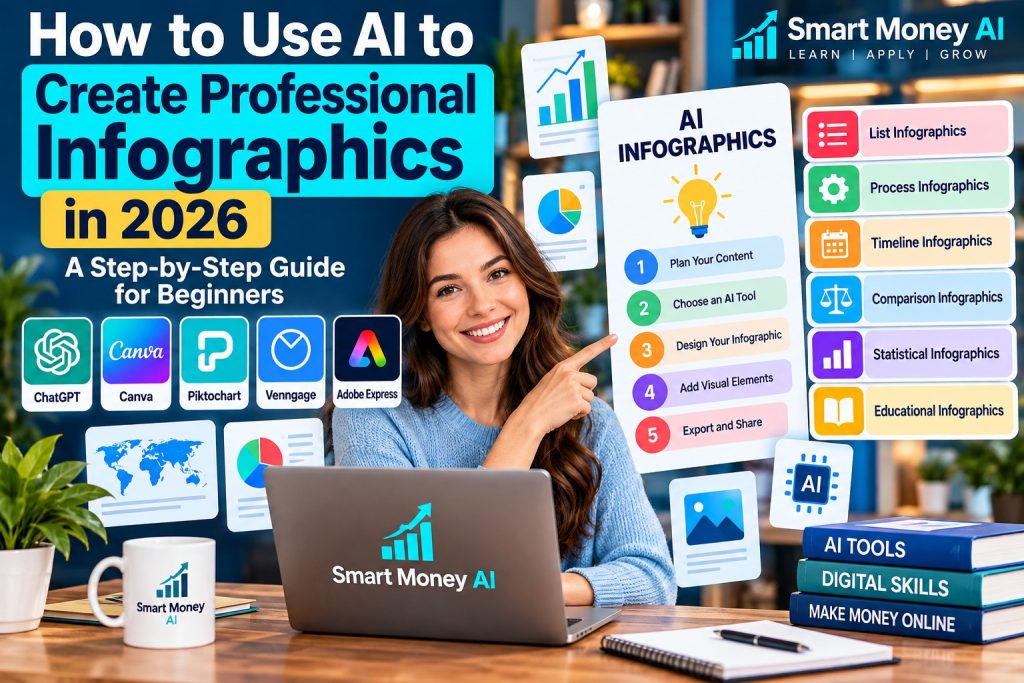
Learning how to create infographics with AI in 2026 is easier than ever for beginners. Creating professional infographics once required graphic design skills, expensive software, and considerable time. Today, artificial intelligence (AI) tools can help beginners turn information into attractive visual content with less manual design work.
Whether you’re a blogger, student, small business owner, freelancer, or content creator, learning how to use AI to create professional infographics can help you communicate information more clearly.
Infographics combine text, icons, charts, illustrations, and visual layouts to explain ideas in an easy-to-understand format. AI can assist with brainstorming, organizing information, suggesting layouts, and generating visual elements.
However, creating an effective infographic still requires human judgment. You must verify facts, review AI-generated text, and ensure that the final design is readable and accurate.
In this beginner-friendly guide, you’ll learn how to use AI to create professional infographics in 2026, explore useful tools, write effective prompts, and follow a practical workflow from idea to finished design.
Table of Contents
1. What Is an AI-Generated Infographic?
An AI-generated infographic is a visual presentation created with assistance from artificial intelligence.
Traditional infographics are usually designed manually using graphics software. AI-assisted infographic creation can simplify parts of the process by helping users:
- Generate infographic ideas.
- Summarize complicated information.
- Organize content into sections.
- Suggest suitable visual layouts.
- Create illustrations and icons.
- Develop headlines and captions.
- Recommend color combinations.
- Improve the readability of written content.
For example, a small business owner might create an infographic explaining five ways customers can protect their online accounts.
An AI assistant could help organize the information, while a design platform could turn it into a professional-looking visual.
Important: Not every AI tool produces a complete, editable infographic. Some tools generate written content or images that must be assembled and corrected in a separate design application.
2. Why Are Infographics Useful in 2026?
People often encounter large amounts of information while browsing websites, social media platforms, and online learning resources.
Infographics can make selected information easier to understand by presenting it visually.
Benefits of Using Infographics
Simplify complicated topics
Infographics can explain processes, comparisons, and instructions without requiring long paragraphs.
Improve content presentation
Visual layouts can make educational articles, presentations, and reports easier to follow.
Support content marketing
Businesses can use infographics to explain products, services, and customer benefits.
Create reusable content
A single infographic may be adapted for a blog post, presentation, newsletter, or social media platform.
Support visual learning
Charts, diagrams, and illustrations can help explain relationships between different pieces of information.
The goal is not simply to make information attractive. A good infographic should help its audience understand something useful.
3. Can Beginners Create Professional Infographics With AI?
Yes. Beginners can create useful infographics with AI assistance, even without advanced graphic design experience.
However, professional results depend on more than selecting a template or generating an image.
You should understand several basic principles:
- Use accurate information.
- Keep the message focused.
- Choose a suitable visual format.
- Organize information logically.
- Maintain readable text.
- Use consistent colors and fonts.
- Review the final design before sharing it.
You do not need to master every design feature immediately.
Start with a simple infographic containing a headline, three to five main points, and a clear conclusion.
As your skills improve, you can experiment with more advanced layouts and data visualizations.
4. Best AI Tools for Creating Infographics in 2026
Different AI tools support different parts of the infographic creation process.
Choosing the right AI tools is an important first step when creating professional infographics. If you’re unfamiliar with AI applications, explore our article 10 Best AI Tools for Beginners: A Practical Guide to discover beginner-friendly tools and understand how they can support different digital tasks.
Some focus on writing and research assistance, while others provide visual design features.
ChatGPT
ChatGPT can help you brainstorm infographic topics, organize information, create outlines, and write concise descriptions.
Beginners can use the official ChatGPT platform to brainstorm infographic ideas, prepare content outlines, simplify complicated explanations, and develop effective design prompts. ChatGPT can also suggest suitable infographic formats and help organize information into clear sections. Always verify AI-generated facts and statistics before including them in your final design.
If you’re new to ChatGPT, learning its basic features can make infographic creation easier. Our beginner-friendly guide, How to Use ChatGPT for Beginners: A Step-by-Step Guide, explains how to get started with ChatGPT, write useful instructions, and use AI assistance for everyday digital tasks. These skills can help you plan infographic content and organize information more effectively.
For example, you could ask ChatGPT to:
- Suggest infographic topics for a beginner audience.
- Convert a long article into five main points.
- Write short headings for infographic sections.
- Recommend suitable chart types.
- Review text for clarity.
- Suggest a visual layout.
Depending on the features available in your account, image-generation capabilities may also help create visual concepts.
However, AI-generated images can contain incorrect text, numbers, or visual details. Review them carefully.
Canva
Canva provides infographic templates, design elements, charts, and AI-assisted creative features.
Beginners can explore the official Canva infographic maker to create professional-looking infographics using customizable templates, charts, icons, and visual elements. Canva allows users to organize information into attractive designs without requiring advanced graphic design skills. Some AI-powered features and premium design elements may require a paid subscription.
Beginners can start with a template and customize:
- Headlines.
- Colors.
- Fonts.
- Icons.
- Illustrations.
- Charts.
- Backgrounds.
- Page dimensions.
Available AI features and usage limits may depend on the user’s account and subscription.
Canva is particularly useful when you want an editable design rather than a single generated image.
Piktochart
Piktochart focuses on visual communication and provides tools for creating infographics, presentations, reports, and other visual materials.
Beginners can explore the official Piktochart infographic maker to create professional infographics using customizable templates and AI-assisted design features. Piktochart helps users transform written information into organized visual content, making it useful for educational materials, business presentations, and reports. Available features and download options may vary depending on the subscription plan.
Its AI-assisted features can help users develop visual content from written information.
Beginners can explore templates and adjust layouts to suit their needs.
Venngage
Venngage provides infographic templates and visual communication tools for creating educational, business, and informational designs.
Beginners can explore the official Venngage infographic maker to create professional-looking infographics using customizable templates, charts, icons, and visual elements. Venngage offers design tools for presenting comparisons, business information, educational content, and step-by-step processes. Some advanced features and export options may require a paid subscription.
It can be useful for comparisons, processes, reports, and other structured visual content.
Feature availability and export options may vary by plan.
Adobe Express
Adobe Express provides design templates, creative assets, and AI-assisted features for producing visual content.
Beginners can explore the official Adobe Express infographic maker to create professional infographics using customizable templates, icons, illustrations, and design elements. Adobe Express provides tools for organizing information into visually appealing layouts suitable for educational content, presentations, and business communication. Some premium templates and advanced features may require a paid subscription.
It can help beginners develop branded graphics and customize infographic-style layouts.
Which Tool Should Beginners Choose?
There is no single best option for everyone.
Choose a tool based on:
- Your experience.
- The type of infographic.
- Available templates.
- Editing capabilities.
- Export options.
- Accessibility features.
- Budget.
Beginner recommendation: Start with an AI assistant for planning and an editable design platform for assembling the final infographic.
This approach gives you more control over text accuracy, spacing, and visual presentation.
5. Step 1: Choose a Clear Infographic Topic
Before opening a design tool, decide what your infographic should explain.
A focused topic makes it easier to create a useful design.
For example, compare these two topics:
Broad topic: Digital Marketing
Focused topic: Five Digital Marketing Tasks Small Businesses Can Simplify With AI
The focused topic is easier to organize into a single infographic.
Beginner-Friendly Topic Ideas
- Five AI Tools for Everyday Productivity.
- Seven Tips for Writing Better Emails.
- How to Organize Files in Google Drive.
- Five Common Online Security Mistakes.
- Steps to Create a Professional Resume.
- How to Prepare for a Virtual Job Interview.
- Six Ways to Improve Website Readability.
Choose a topic that matches your audience’s interests.
Avoid including too many unrelated ideas in one infographic.
6. Step 2: Identify Your Target Audience
Your target audience influences the information, language, and design style.
For example, an infographic for elementary school students should look different from one intended for business professionals.
Ask yourself:
- Who will read this infographic?
- What do they already know?
- What problem are they trying to solve?
- What should they learn?
- Where will they view the infographic?
For a USA beginner audience, use straightforward English, familiar examples, and clear explanations.
If the infographic includes measurements, currency, or statistics, use units and formatting appropriate for the intended audience.
7. Step 3: Research and Verify Your Information
Accurate information is essential.
AI assistants can help organize research, but they may produce outdated information, incorrect statistics, or fabricated references.
Before creating your infographic:
- Identify the main facts you need.
- Consult reliable sources.
- Check publication dates.
- Verify numerical claims.
- Record the original sources.
- Separate facts from opinions.
- Remove unsupported claims.
Example
Suppose you’re preparing an infographic about internet usage in the United States.
Instead of asking AI to invent statistics, obtain relevant data from an appropriate official source.
You can then use AI to help summarize the findings.
Important: Never publish AI-generated statistics without checking them against their original sources.
8. Step 4: How to Create Infographics With AI Using a Simple Outline
Once you have reliable information, organize it into a simple structure.
A useful infographic outline might include:
- Main headline.
- Short introduction.
- Three to seven key points.
- Supporting icons or charts.
- Final takeaway.
- Source information.
Example AI Prompt
“Act as a professional infographic content planner. Create a beginner-friendly infographic outline about five ways small businesses can use AI to save time. Include a short headline, five practical points, a one-sentence explanation for each point, suggested icons, and a concluding takeaway. Use clear American English. Do not invent statistics or research findings.”
This prompt gives the AI a clear task, audience, topic, and output format.
Writing effective AI prompts is an important skill when creating professional infographics. Clear instructions help AI tools generate better outlines, organize information, and suggest suitable visual layouts. If you want to improve your prompting skills, read our guide, How to Write Better AI Prompts in 2026: 12 Practical Techniques for Beginners, which explains practical methods for getting more useful AI-generated responses.
Review the outline before moving to the design stage.
9. Step 5: Choose the Right Infographic Format
Different infographic formats serve different purposes.
List Infographics
Best for tips, recommendations, and key facts.
Example: Seven Essential Digital Skills for Beginners.
Process Infographics
Best for explaining a sequence of steps.
Example: How to Create a Professional Email Signature.
Timeline Infographics
Best for presenting events in chronological order.
Example: The Evolution of Artificial Intelligence.
Comparison Infographics
Best for comparing two or more options.
Example: Free vs. Paid AI Design Tools.
Statistical Infographics
Best for presenting verified numerical data.
Example: Survey Results From a Small Business Customer Study.
Educational Infographics
Best for explaining concepts or providing learning resources.
Example: Understanding Common Cybersecurity Terms.
Beginner recommendation: Start with a list or process infographic because these formats are relatively easy to organize.
10. Step 6: Write Short, Clear Infographic Content
An infographic should not look like a full article squeezed into an image.
Keep the wording concise.
Instead of writing:
“Artificial intelligence technology can potentially assist business owners in organizing a wide variety of administrative responsibilities and repetitive operational activities.”
Write:
“Use AI to organize repetitive business tasks.”
Shorter text is usually easier to scan.
Practical Writing Tips
- Use short headlines.
- Prefer simple words.
- Limit each section to one main idea.
- Avoid unnecessary jargon.
- Explain unfamiliar terms.
- Remove repeated information.
- Keep labels consistent.
AI can suggest shorter wording, but always review the meaning before using it.
11. Step 7: Generate an Infographic Design Prompt
A detailed design prompt helps AI understand the visual result you want.
Include the following information:
- Topic.
- Audience.
- Layout.
- Color scheme.
- Typography.
- Number of sections.
- Icons or illustrations.
- Aspect ratio or dimensions.
- Visual style.
- Text requirements.
Example Professional Infographic Prompt
“Create a clean, professional infographic concept titled ‘5 Ways Small Businesses Can Use AI to Save Time.’
Audience: Beginner small business owners in the United States.
Layout: Vertical infographic with five numbered sections.
Design style: Modern, minimal, professional, and easy to read.
Colors: Dark navy, white, and subtle teal accents.
Typography: Clear sans-serif headings and readable body text.
Visual elements: Simple icons representing email, scheduling, customer support, content creation, and document organization.
Include a strong headline, five short information sections, and a final takeaway.
Use consistent spacing and a clear visual hierarchy.
Avoid clutter, unnecessary decorations, unsupported statistics, and watermarks.
Ensure all text is spelled correctly and remains readable.”
You can use this prompt as a starting point and customize it for your topic.
If the image generator produces inaccurate text, create the visual layout first and add corrected text manually in an editable design tool.
12. Step 8: Create Your First Infographic With Canva
Canva is one option for assembling a beginner-friendly infographic.
The following workflow focuses on using an editable design rather than relying entirely on AI-generated images.
Step 1: Open Canva
Sign in to Canva and search for infographic templates.
Step 2: Choose a Template
Select a layout that matches your content.
For example, use a vertical process template for a five-step tutorial.
Step 3: Add Your Headline
Replace the template title with your infographic headline.
Keep it short and specific.
Step 4: Add AI-Assisted Content
Copy the verified outline you prepared earlier.
Insert the text into the appropriate sections.
Step 5: Customize Visual Elements
Choose icons, illustrations, or charts that support the message.
Avoid adding graphics merely to fill empty space.
Step 6: Adjust Colors and Fonts
Use a consistent color palette and readable typography.
For a business infographic, a restrained design often works better than using many unrelated colors.
Step 7: Review the Layout
Check that headings, icons, and text blocks are aligned.
Ensure the infographic remains readable on the intended device.
Step 8: Export the Design
Download the infographic in a suitable format.
Available formats and export features may depend on the design platform and account plan.
You now have a basic infographic that can be reviewed and refined.
13. Step 9: Use AI to Improve Your Infographic Layout
After creating your first version, use AI to evaluate the structure.
You can describe your design or provide an image to a tool that supports image analysis.
Example AI Review Prompt
“Review this infographic for beginner readability. Identify sections with too much text, unclear headings, inconsistent spacing, or confusing visual organization. Suggest specific improvements without changing verified facts.”
AI feedback may help you identify areas for improvement.
However, visual judgments can be subjective.
Consider the intended audience and review the infographic yourself before making changes.
14. Step 10: Add Charts and Data Visualizations
Charts can make numerical information easier to understand.
Common chart types include:
Bar charts: Compare values across categories.
Line charts: Show changes over time.
Pie charts: Display parts of a whole when the categories are appropriate and clearly defined.
Tables: Present exact values when precise comparisons matter.
Example
Suppose a business conducts a customer survey asking respondents which support channel they prefer.
The results could be displayed in a bar chart.
Before publishing:
- Verify the original survey data.
- Label each category.
- Include appropriate units.
- Avoid misleading scales.
- Explain the sample size when relevant.
- Identify the source.
Do not use invented numbers merely to make the infographic look professional.
15. Step 11: Choose Professional Colors and Fonts
Colors and typography affect readability.
For beginners, a simple visual system is usually easier to manage.
Color Selection Tips
Use two or three primary colors.
Choose sufficient contrast between text and background.
Use accent colors to highlight important information.
Avoid combinations that make text difficult to read.
Typography Tips
Choose readable fonts.
Use larger headings than body text.
Limit the number of font families.
Maintain consistent font sizes for similar elements.
Avoid decorative fonts for long explanations.
Example color combination:
- Dark navy for headings.
- White or light gray for backgrounds.
- Teal for highlights.
You can adjust the palette to match your brand.
16. Step 12: Add Icons and Illustrations
Icons can help readers identify information quickly.
For example:
- An envelope icon can represent email.
- A calendar icon can represent scheduling.
- A shield icon can represent security.
- A chart icon can represent analytics.
- A document icon can represent reports.
Choose icons that clearly match the accompanying text.
Use a consistent illustration style throughout the design.
Also review the licensing terms for graphics, icons, and templates before using them commercially.
17. Step 13: Check Accessibility and Readability
A professional infographic should be understandable to as many readers as possible.
Creating accessible infographics helps more people understand your visual content, including readers with visual or other disabilities. Beginners can explore the official W3C Web Accessibility Initiative to learn about readable text, sufficient color contrast, meaningful image descriptions, and accessible digital content. These principles can help you create infographics that are clearer and easier to use.
Accessibility Checklist
- Use readable font sizes.
- Maintain sufficient color contrast.
- Avoid communicating meaning through color alone.
- Use clear labels for charts.
- Arrange content in a logical order.
- Avoid excessive visual clutter.
- Provide a useful text alternative when publishing online.
If your infographic contains important instructions or data, consider providing the same information in accessible text alongside the image.
An image description alone may not fully communicate a complex chart or detailed infographic.
18. Step 14: Verify AI-Generated Text and Visuals
AI-generated designs sometimes contain errors.
Common problems include:
- Misspelled words.
- Incorrect numbers.
- Repeated sections.
- Unclear icons.
- Distorted illustrations.
- Inconsistent labels.
- Unsupported claims.
- Misleading charts.
Final Accuracy Checklist
Read every word in the infographic.
Compare numerical values with their original sources.
Check that illustrations match the information.
Review charts for accuracy.
Remove unsupported claims.
Correct errors using an editable design tool.
Remember: Attractive visuals do not make incorrect information reliable.
19. Step 15: Export Your Infographic in the Right Format
The best export format depends on where you plan to use the infographic.
PNG
Useful for online graphics that need clear text and illustrations.
JPG
Useful when smaller file sizes are important, although compression can reduce image quality.
Useful for documents, printable materials, and sharing layouts that should retain their formatting.
SVG
Useful for scalable vector graphics when the design tool and export plan support it.
Before exporting, check:
- Image dimensions.
- File size.
- Text readability.
- Export quality.
- Platform requirements.
Always review the exported file rather than assuming it matches the editor preview.
20. Step 16: Optimize Infographics for Websites
If you’re publishing an infographic on a website, consider both the reader experience and technical performance.
Optimizing infographics for search engines can help make your visual content easier to discover and understand. Beginners can follow Google’s official Image SEO Best Practices to learn about descriptive image filenames, meaningful alternative text, relevant surrounding content, and responsive images. These techniques can improve image accessibility and help search engines understand the purpose of your infographics.
Website Optimization Tips
Use a descriptive filename
Example: ai-infographic-creation-guide-2026.png
Write meaningful alternative text
Describe the infographic’s purpose and key information.
Use appropriate dimensions
Avoid unnecessarily large image files.
Compress images carefully
Reduce file size without making text difficult to read.
Include supporting written content
Provide useful explanations around the infographic.
Check mobile readability
Preview the infographic on smaller screens.
A very tall infographic may become difficult to read when displayed at a narrow width.
Consider dividing complex information into multiple visuals when necessary.
21. Step 17: Share Your Infographic Online
Once your infographic is complete, you can share it through suitable channels.
Blog Posts
Use infographics to summarize important information from an article.
Social Media
Adapt the design to the dimensions and viewing habits of the platform.
Presentations
Use infographic sections to explain processes or comparisons.
Email Newsletters
Include a readable image or link to the complete infographic.
Educational Materials
Create visual summaries for lessons, tutorials, or training resources.
Business Reports
Use verified charts and diagrams to communicate findings.
Tip: One infographic may need different layouts for different platforms. Resizing alone does not always produce a readable result.
22. Step 18: Create Consistent Branded Infographics
If you regularly create content for a website or business, consistent branding can make your visuals easier to recognize.
Develop a simple infographic style guide that includes:
- Logo placement.
- Brand colors.
- Heading fonts.
- Body fonts.
- Icon styles.
- Standard layouts.
- Source formatting.
- Footer design.
For example, a Smart Money AI infographic could use a dark navy background, teal highlights, clear headings, and a small brand logo.
Keep branding visible but avoid letting it distract from the information.
23. Step 19: Save Time With a Repeatable AI Workflow
Creating every infographic from scratch can be inefficient.
A repeatable workflow helps maintain quality.
Recommended Workflow
Stage 1: Research
Collect and verify information.
Stage 2: Content Planning
Use AI to organize the main points.
Stage 3: Outline
Prepare the headline, sections, and takeaway.
Stage 4: Design
Choose a template and assemble the visual layout.
Stage 5: Review
Check spelling, facts, charts, and readability.
Stage 6: Export
Save the infographic in the required format.
Stage 7: Publish
Share the finished design with appropriate descriptions and source information.
Save successful layouts as reusable templates.
This can make future infographic projects easier to manage.
24. Step 20: Avoid Common AI Infographic Mistakes
Beginners often focus too much on appearance and not enough on communication.
Avoid these mistakes.
Mistake 1: Including Too Much Information
An infographic should communicate a focused message.
Break complicated topics into multiple visuals when necessary.
Mistake 2: Trusting AI-Generated Statistics
Always verify numbers and research claims.
Mistake 3: Using Too Many Colors
Choose a consistent color palette.
Mistake 4: Selecting Unreadable Fonts
Prioritize readability over decorative appearance.
Mistake 5: Ignoring Mobile Users
Check whether text remains readable on smaller screens.
Mistake 6: Using Misleading Charts
Choose appropriate chart types and scales.
Mistake 7: Forgetting Source Information
Include relevant source details when presenting researched facts or statistics.
Mistake 8: Publishing Without Reviewing
Check the final exported file for errors.
Mistake 9: Using Graphics Without Checking Licensing
Review commercial-use permissions before publishing designs for clients or businesses.
Mistake 10: Expecting AI to Complete Every Task Perfectly
AI can accelerate certain tasks, but professional-quality results still require editing and verification.
25. A Seven-Day AI Infographic Learning Plan
You can develop basic infographic creation skills through a simple practice schedule.
Day 1: Learn Infographic Basics
Explore list, process, comparison, and statistical infographics.
Identify examples with clear layouts.
Day 2: Practice AI Content Planning
Choose a topic and use an AI assistant to create an outline.
Verify the information.
Day 3: Explore Design Templates
Open an infographic design tool and experiment with a few templates.
Day 4: Create Your First Infographic
Build a simple five-point infographic.
Day 5: Improve Your Design
Review typography, spacing, colors, and visual hierarchy.
Day 6: Test Readability
Check the infographic on desktop and mobile devices.
Correct any problems.
Day 7: Complete a Portfolio Example
Export your finished infographic and save it as a sample of your work.
By the end of the week, you should have practical experience with the basic creation process.
26. Practical Infographic Ideas for Beginners
If you’re unsure what to create, start with one of these projects.
Project 1: AI Productivity Tips
Create a five-section infographic explaining practical ways AI can help organize everyday tasks.
Project 2: Digital Skills Checklist
Design a visual checklist covering essential computer and internet skills.
Project 3: Small Business Workflow
Illustrate a simple customer inquiry process.
Project 4: Online Safety Guide
Create an infographic explaining common online security precautions.
Project 5: Website Improvement Checklist
Design a visual guide covering navigation, readability, mobile usability, and page performance.
Website improvement checklists are excellent topics for educational infographics because they present practical information in a clear visual format. For more ideas, explore our guide How to Start an AI-Assisted Website Testing Service in 2026: A Beginner’s Guide, which explains how to evaluate website navigation, mobile responsiveness, page performance, and user experience.
These projects can help you practice different layouts while creating useful educational content.
27. Frequently Asked Questions
Can I create professional infographics with AI for free?
Yes, you can begin with free tools and free features offered by some AI and design platforms. However, usage limits, premium templates, advanced AI capabilities, and export options may require a paid subscription.
Do I need graphic design experience?
No. Beginners can start with templates and simple layouts. Learning basic design principles will help improve the quality of your work.
Which AI tool is best for infographic creation?
The best tool depends on your needs. ChatGPT can assist with planning and writing, while design platforms such as Canva, Piktochart, Venngage, and Adobe Express provide visual creation and editing features.
Can ChatGPT create infographics?
ChatGPT can help plan infographic content, suggest layouts, and, where image-generation features are available, assist with creating visual concepts. You should still review text, numbers, and visual accuracy before publishing.
Can I use AI-generated infographics commercially?
Commercial use depends on the terms of the AI service, design platform, templates, fonts, and other assets involved. Review applicable licensing terms and avoid using materials without the necessary rights.
How long does it take to create an infographic with AI?
The time depends on the complexity of the topic, research requirements, design experience, and editing needs. A simple infographic may take much less time than a detailed statistical or research-based design.
Are AI-generated infographics always accurate?
No. AI-generated content can contain factual errors, incorrect numbers, spelling mistakes, and misleading visuals. Human review remains essential.
What is the best infographic size?
There is no universal size. Choose dimensions based on where the infographic will be published and ensure that text remains readable on the intended devices.
Can I use infographics in blog posts?
Yes. Infographics can complement written articles by summarizing processes, comparisons, and key information. Include supporting text and appropriate alternative descriptions for accessibility.
Can I offer infographic creation as a freelance service?
Yes, infographic design can be offered as a digital service. However, client work requires clear expectations, accurate information, suitable licensing, reliable delivery, and consistent design quality. Earnings are not guaranteed.
28. Final Thoughts
Learning how to use AI to create professional infographics in 2026 can help beginners develop practical visual communication skills.
AI tools can assist with brainstorming, organizing content, writing short explanations, and exploring design ideas. Editable design platforms can then help turn those ideas into useful visual materials.
The most important lesson is that a successful infographic is not simply an attractive image.
It should communicate accurate information through a clear, readable, and well-organized design.
Start with a simple topic, verify your information, choose a suitable template, and create your first infographic.
As you gain experience, you can develop reusable templates, improve your design skills, and create infographics for websites, presentations, educational resources, and business communications.
Summary
AI-assisted infographic creation involves five essential activities: researching reliable information, organizing the content, choosing a suitable visual format, building the design, and checking the finished result.
Beginners can start with simple tools and gradually improve their skills through regular practice.
Editor’s Note
AI tools, subscription plans, and design features may change over time. Always check current product capabilities, licensing terms, and export options before selecting a platform. Verify all AI-generated facts and statistics before publishing.
Your Next Step
Choose one beginner-friendly topic and create a simple five-point infographic using an AI assistant and an editable design platform.
Focus on accuracy, readability, and usefulness rather than trying to create a complicated design on your first attempt.